1.0 Critiques and Improvements of Data Visualisation
The Report on Labour Force in Singapore (https://stats.mom.gov.sg/Pages/Labour-Force-In-Singapore-2019.aspx) is a key annual report on Singapore’s labour market. Below is a critique of MOM’s data visualisation on the resident labour force and how it can be improved. The data is available at https://stats.mom.gov.sg/Pages/Labour-Force-Tables2019.aspx, Table 5, Resident Labour Force Participation Rate by Age and Sex, 2009 - 2019 (June), and Table 7, Resident Labour Force Aged Fifteen Years and Over by Age and Sex, 2009 - 2019 (June).
Clarity
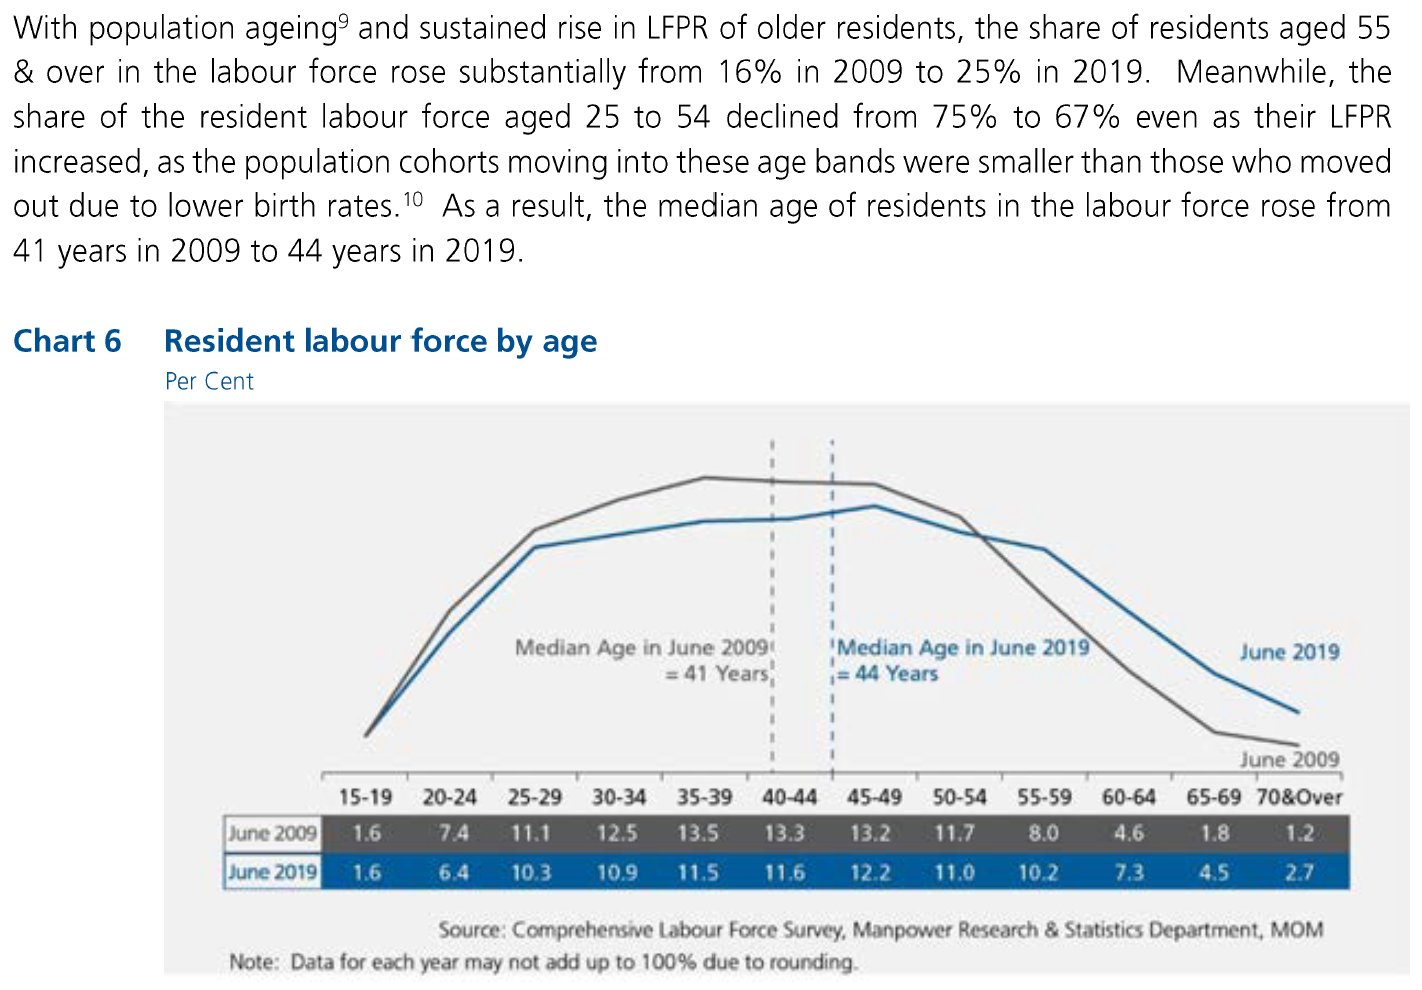
- By looking at the two lines (blue and grey) in the data visualisation, we can generally tell that the share of resident labour force aged 55 & over was higher in 2019 (blue line) than 2009 (grey line) and lower for residents aged 25 to 54, which were mentioned in the lead-in paragraph. However, a line chart should not be used, as data was aggregated at each age range and it would otherwise make readers imply that the share of resident labour force can be interpolated and calculated at each age.
- A scatter plot can be used instead, with each point showing the share of resident labour force at each age range.
- The lead-in paragraph compared the 2009 and 2019 share of resident labour force aged 25 to 54 and 55 & over. However, it is hard for readers to tabulate and compare the total share of resident labour force for these age ranges, as the data values were mostly given in 5-year age range. Furthermore, having too many age ranges make comparison tedious as well as redundant when the data values are similar.
- Fewer age ranges can be used (15 to 24, 25 to 54, 55 to 64 and 65 & over) for the scatter plot to improve readability and aid comparison. The share of resident labour force and labour force participation rate for these age ranges will be calculated using the available data.
- The reference lines clearly showed that the median age of residents in the labour force was higher in 2019 than 2009. However, it gives a wrong impression that the share of resident labour force can be interpolated and calculated at each age.
- The reference lines can be removed from the data visualisation to prevent confusion.
- The lead-in paragraph talks about the labour force participation rate. However, we cannot tell from the data visualisation how the labour force participation rate in 2019 differs from 2009.
- The labour force participation rate can be used as the size for each point on the scatter plot i.e. bigger point implies higher labour force participation rate at the age range.
- The title of the data visualisation should not be “resident labour force by age”. It gives a false impression that we can interpolate and find the share of resident labour force at each age.
- The title can be changed to “How did the Resident Labour Force (%) at each Age Range change from 2009 to 2019?” to correctly represent the data given and make it appealing to readers.
Aesthetics
- The use of two contrasting colours (blue and grey) for the lines and table rows clearly showed the data values belonging to the two years.
- For the improved data visualisation, we can similarly use two contrasting colours for the scatter plot and data values.
- The multiple labelling of “June 2009” and “June 2019” is not necessary, given the use of colours to differentiate the years.
- The multiple labels can be removed and a legend can be created to show the colours (for the scatter plot and data values) that represent each year.
- The tick marks on the x-axis are wrongly placed, inappropriate and confusing, as age range should be a categorical rather than a continuous variable. It gives a wrong impression that we can interpolate and find the share of resident labour force at each age.
- The tick marks on the x-axis are not necessary and can be removed.
- The data source is properly and clearly labelled at the bottom of the data visualisation.
- Similarly, we can label the data source clearly in the improved data visualisation.
Sketch of Proposed Design
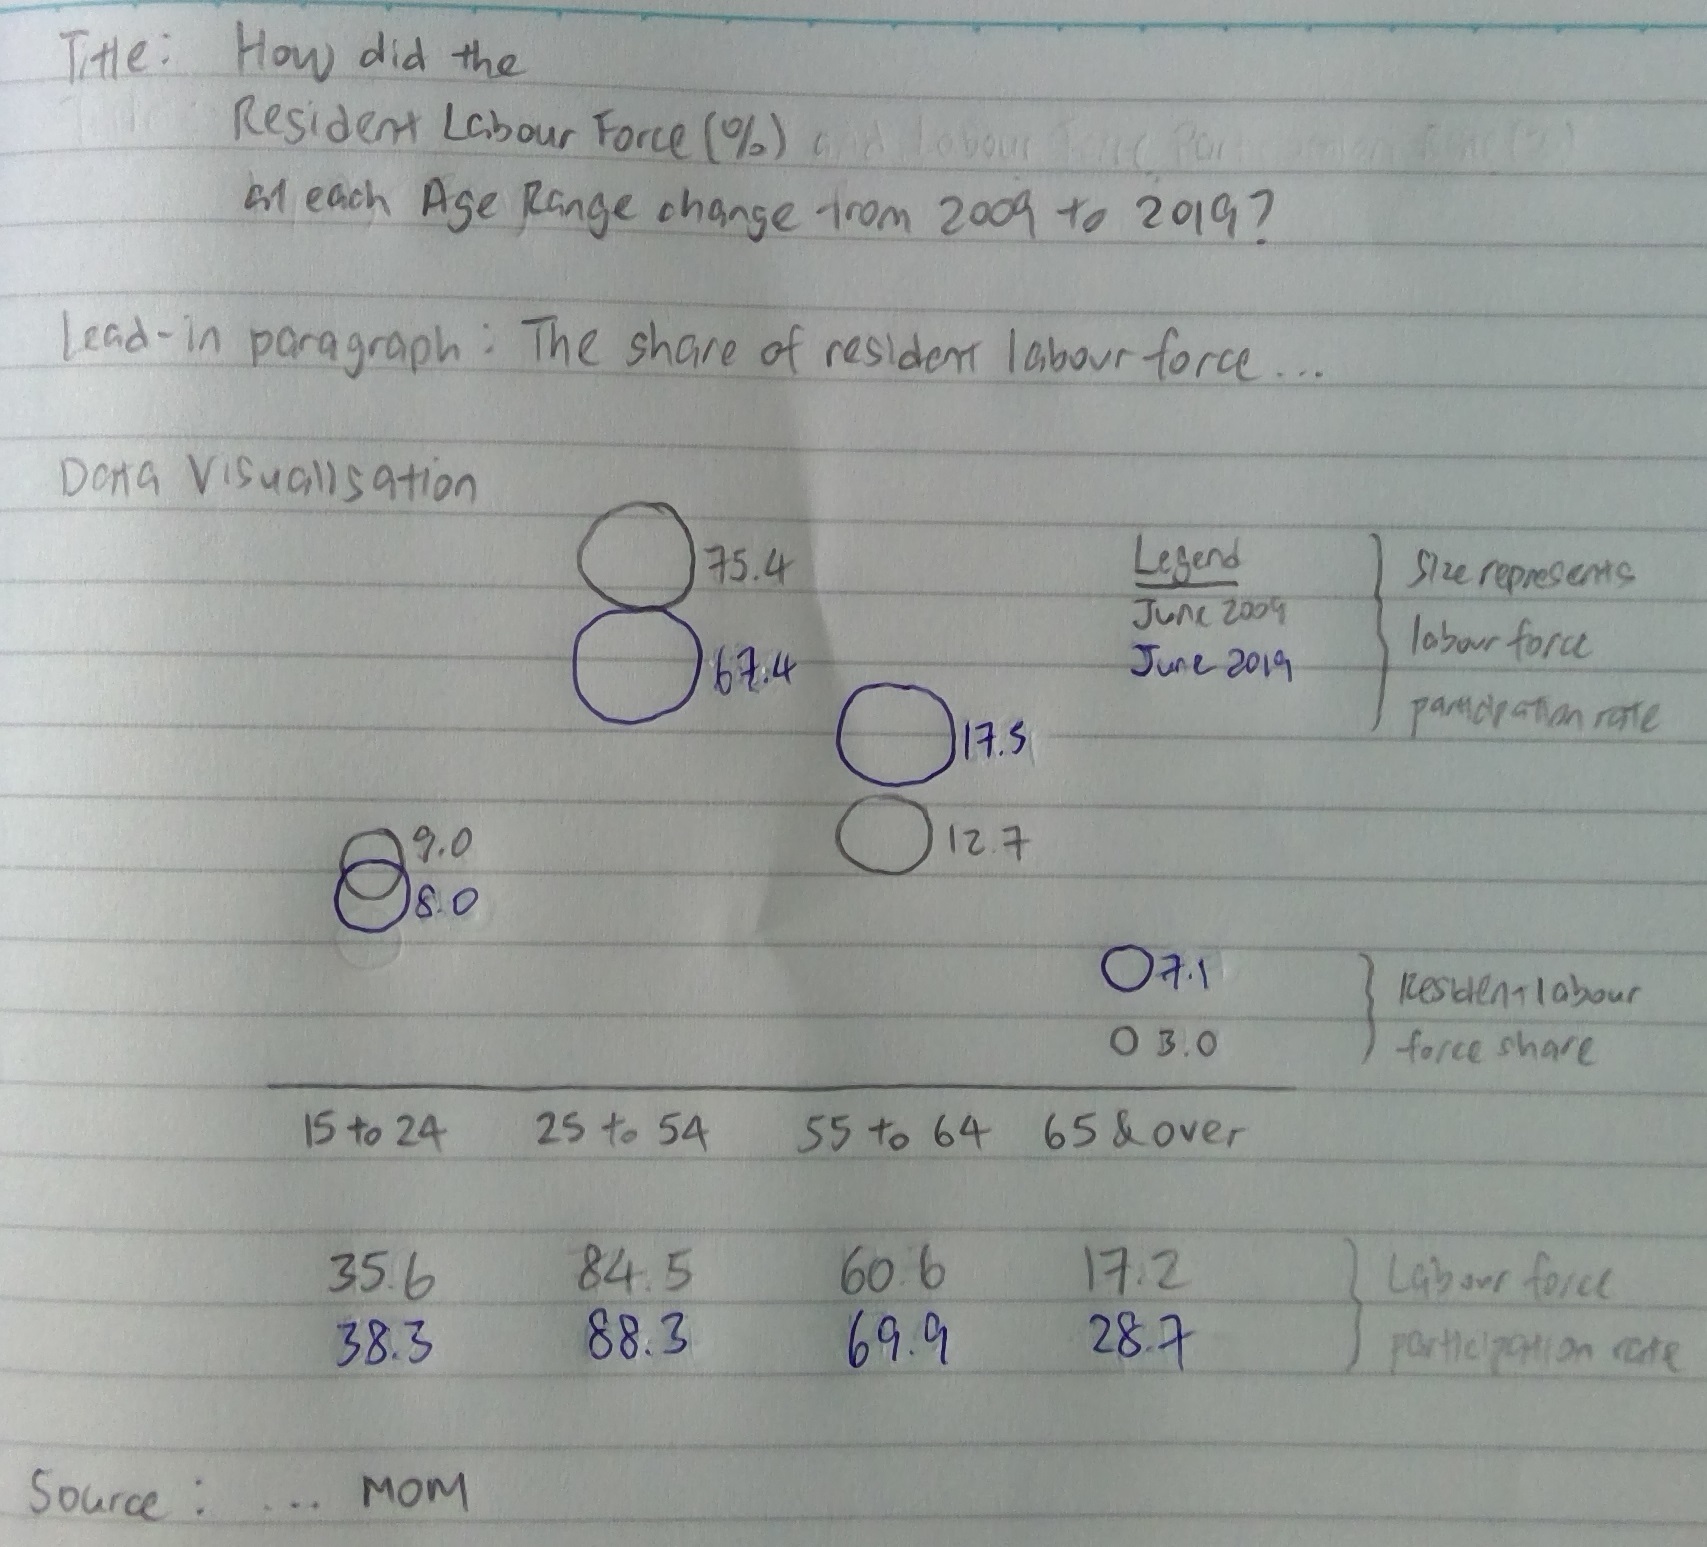
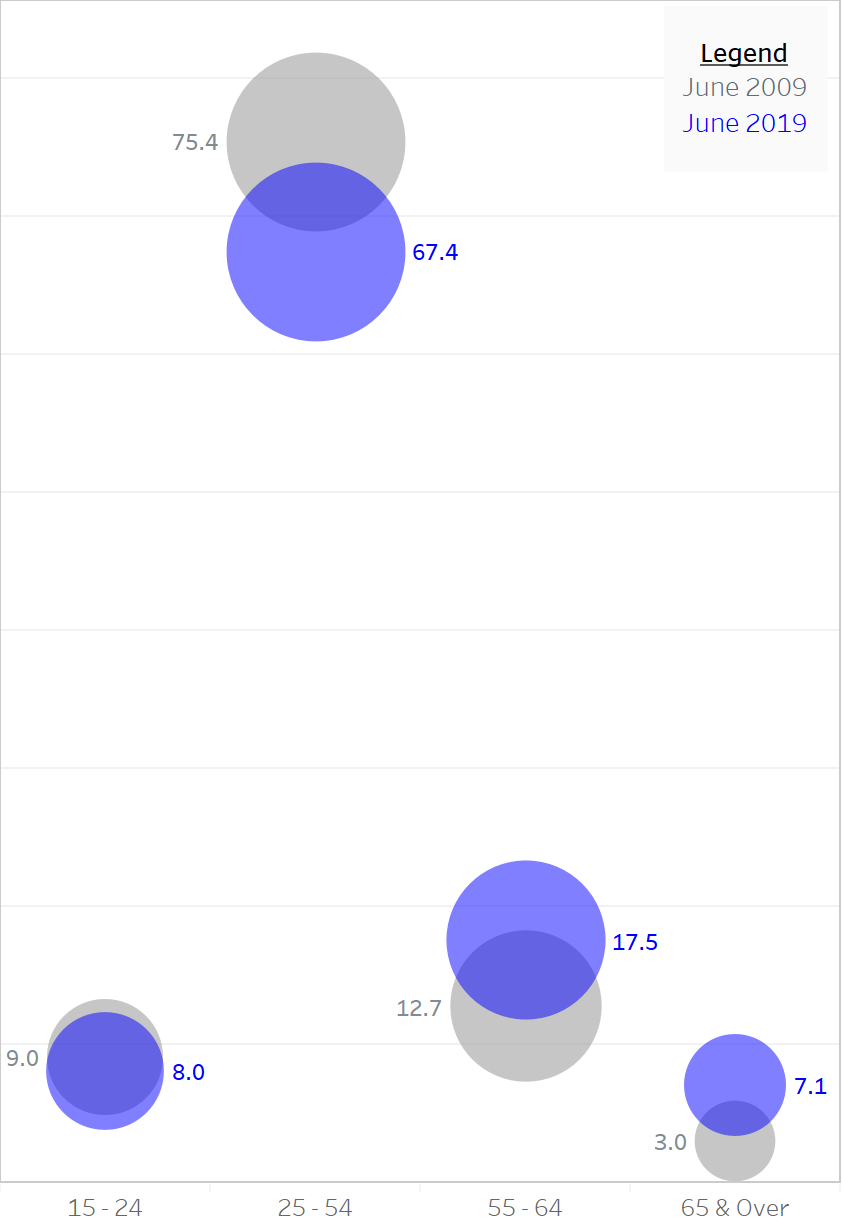
- The first key message to convey is the change in the share of resident labour force from 2009 to 2019. Each point in the scatter plot represents the share of resident labour force at each age range and they are properly labelled with the data values. Readers will not be confused that the values can be interpolated at each age.
- The next level of details to show readers is the labour force participation rate in 2009 and 2019. It can be easily compared by either looking at the size of the points or referring to the values in the table.
- All points and data values are clearly shown and coloured according to the year.
2.0 Step-by-Step Description of Data Visualisation Preparation
Data Preparation
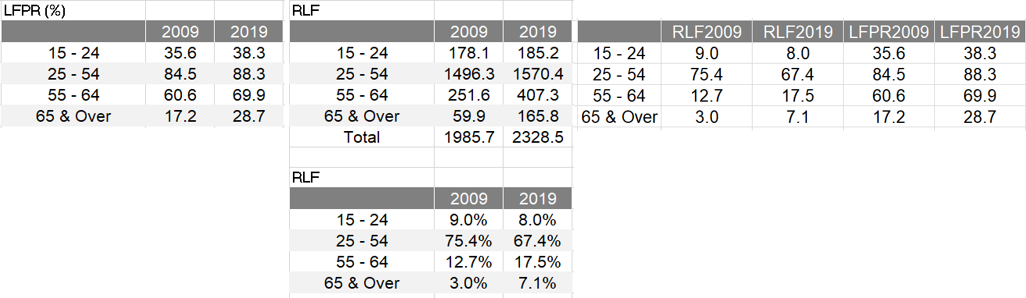
- The available data values from 2009 to 2019 for Resident Labour Force (RLF) and Labour Force Participation Rate (LFPR) are analysed. There is no notable change or spike in values between 2009 and 2019. Hence, the proposed data visualisation will focus on 2009 and 2019 values.
- The 2009 and 2019 values for four age ranges (15 to 24, 25 to 54, 55 to 64, 65 & over) are collated in Excel. Additional calculations are required to convert LFPR from thousands to percentage (%).
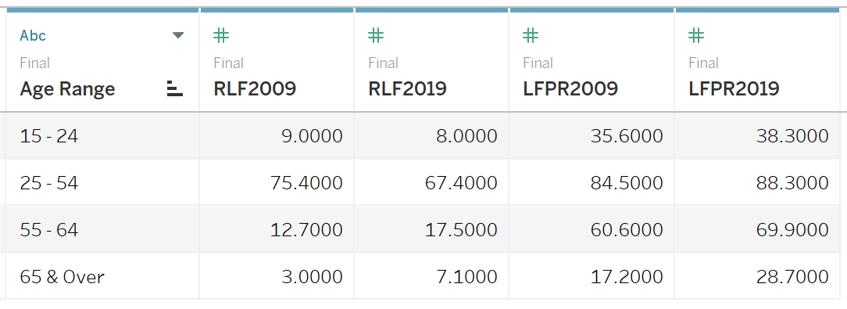
- The data values are then imported onto Tableau. The columns are renamed to appropriately represent the data values i.e. Age Range, RLF2009, RLF2019, LFPR2009, LFPR2019.
Scatter Plot
- “Age Range” is placed under Columns and “RLF2009” and “RLF2019” are placed under Rows.
- The bar charts are converted into scatter plot by clicking on dual axis. The axes are also synchronised.
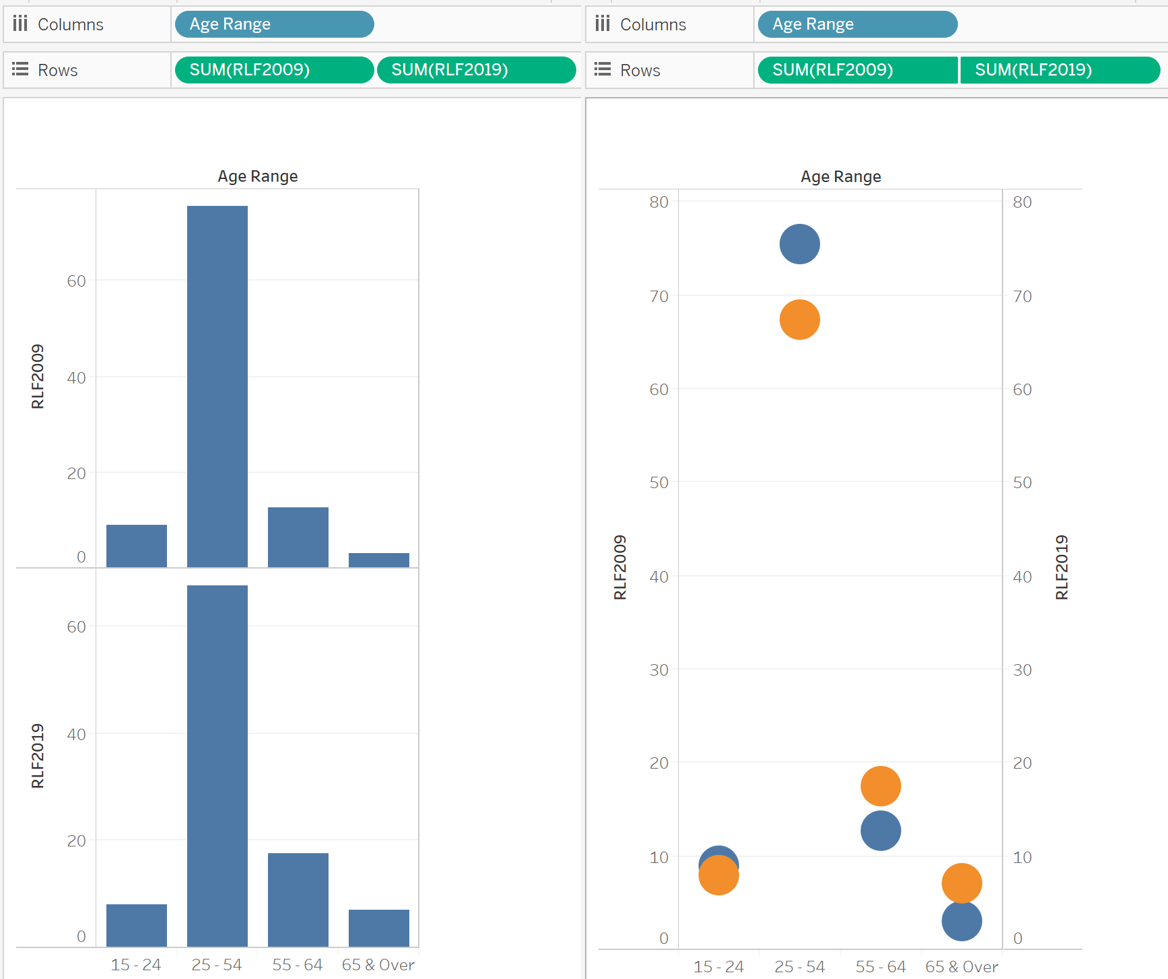
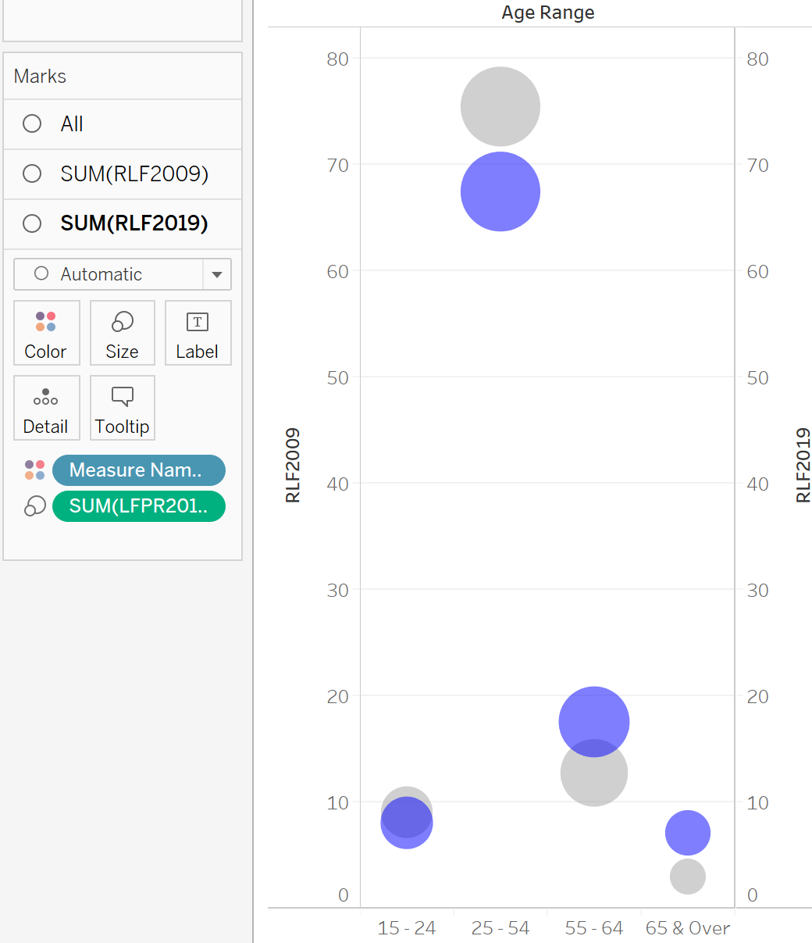
- To allow comparison of the labour force participation rate, “LFPR2009” and “LFPR2019” are placed under Size. The size of the points will reflect the labour force participation rate i.e. larger dot will indicate higher labour force participation rate.
- As there are overlaps of the points, the opacity is set at 50% to allow easier comparison between the data values in 2009 and 2019. To further facilitate comparison, the size of the points is increased and contrasting colours (grey and blue) are used for 2009 and 2019 points after placing “Measure Names” under Colour.
- “RLF2009” and “RLF2019” are placed under Label to show the RLF data values for 2009 and 2019. The labels are properly aligned and coloured according to the year.
- A legend is created using Annotation to show the colours that represent each year and therefore, multiple labelling is not required. The headers and field label for columns are also hidden to simplify the chart for readers and the dimensions of the chart are adjusted.
Data Table on Labour Force Participation Rate
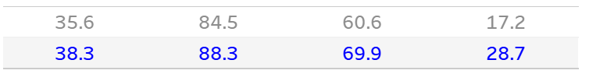
- “Age Range” is placed under Columns and “LFPR2009” and “LFPR2019” are placed under Rows. Text Table under Show Me is clicked to generate the data table for LFPR. The rows and columns are swapped.
- “Measure Names” is placed under Colour and the font colours are changed to match the year.
- The headers and field label for columns are hidden to simplify the chart for readers and reduce redundancy.
Dashboard
- A dashboard is created. The title, lead-in paragraph and source are added as text. The scatter plot and LFPR data table are added. Blanks are added to adjust the dashboard dimensions.
3.0 Proposed Data Visualisation Using Tableau
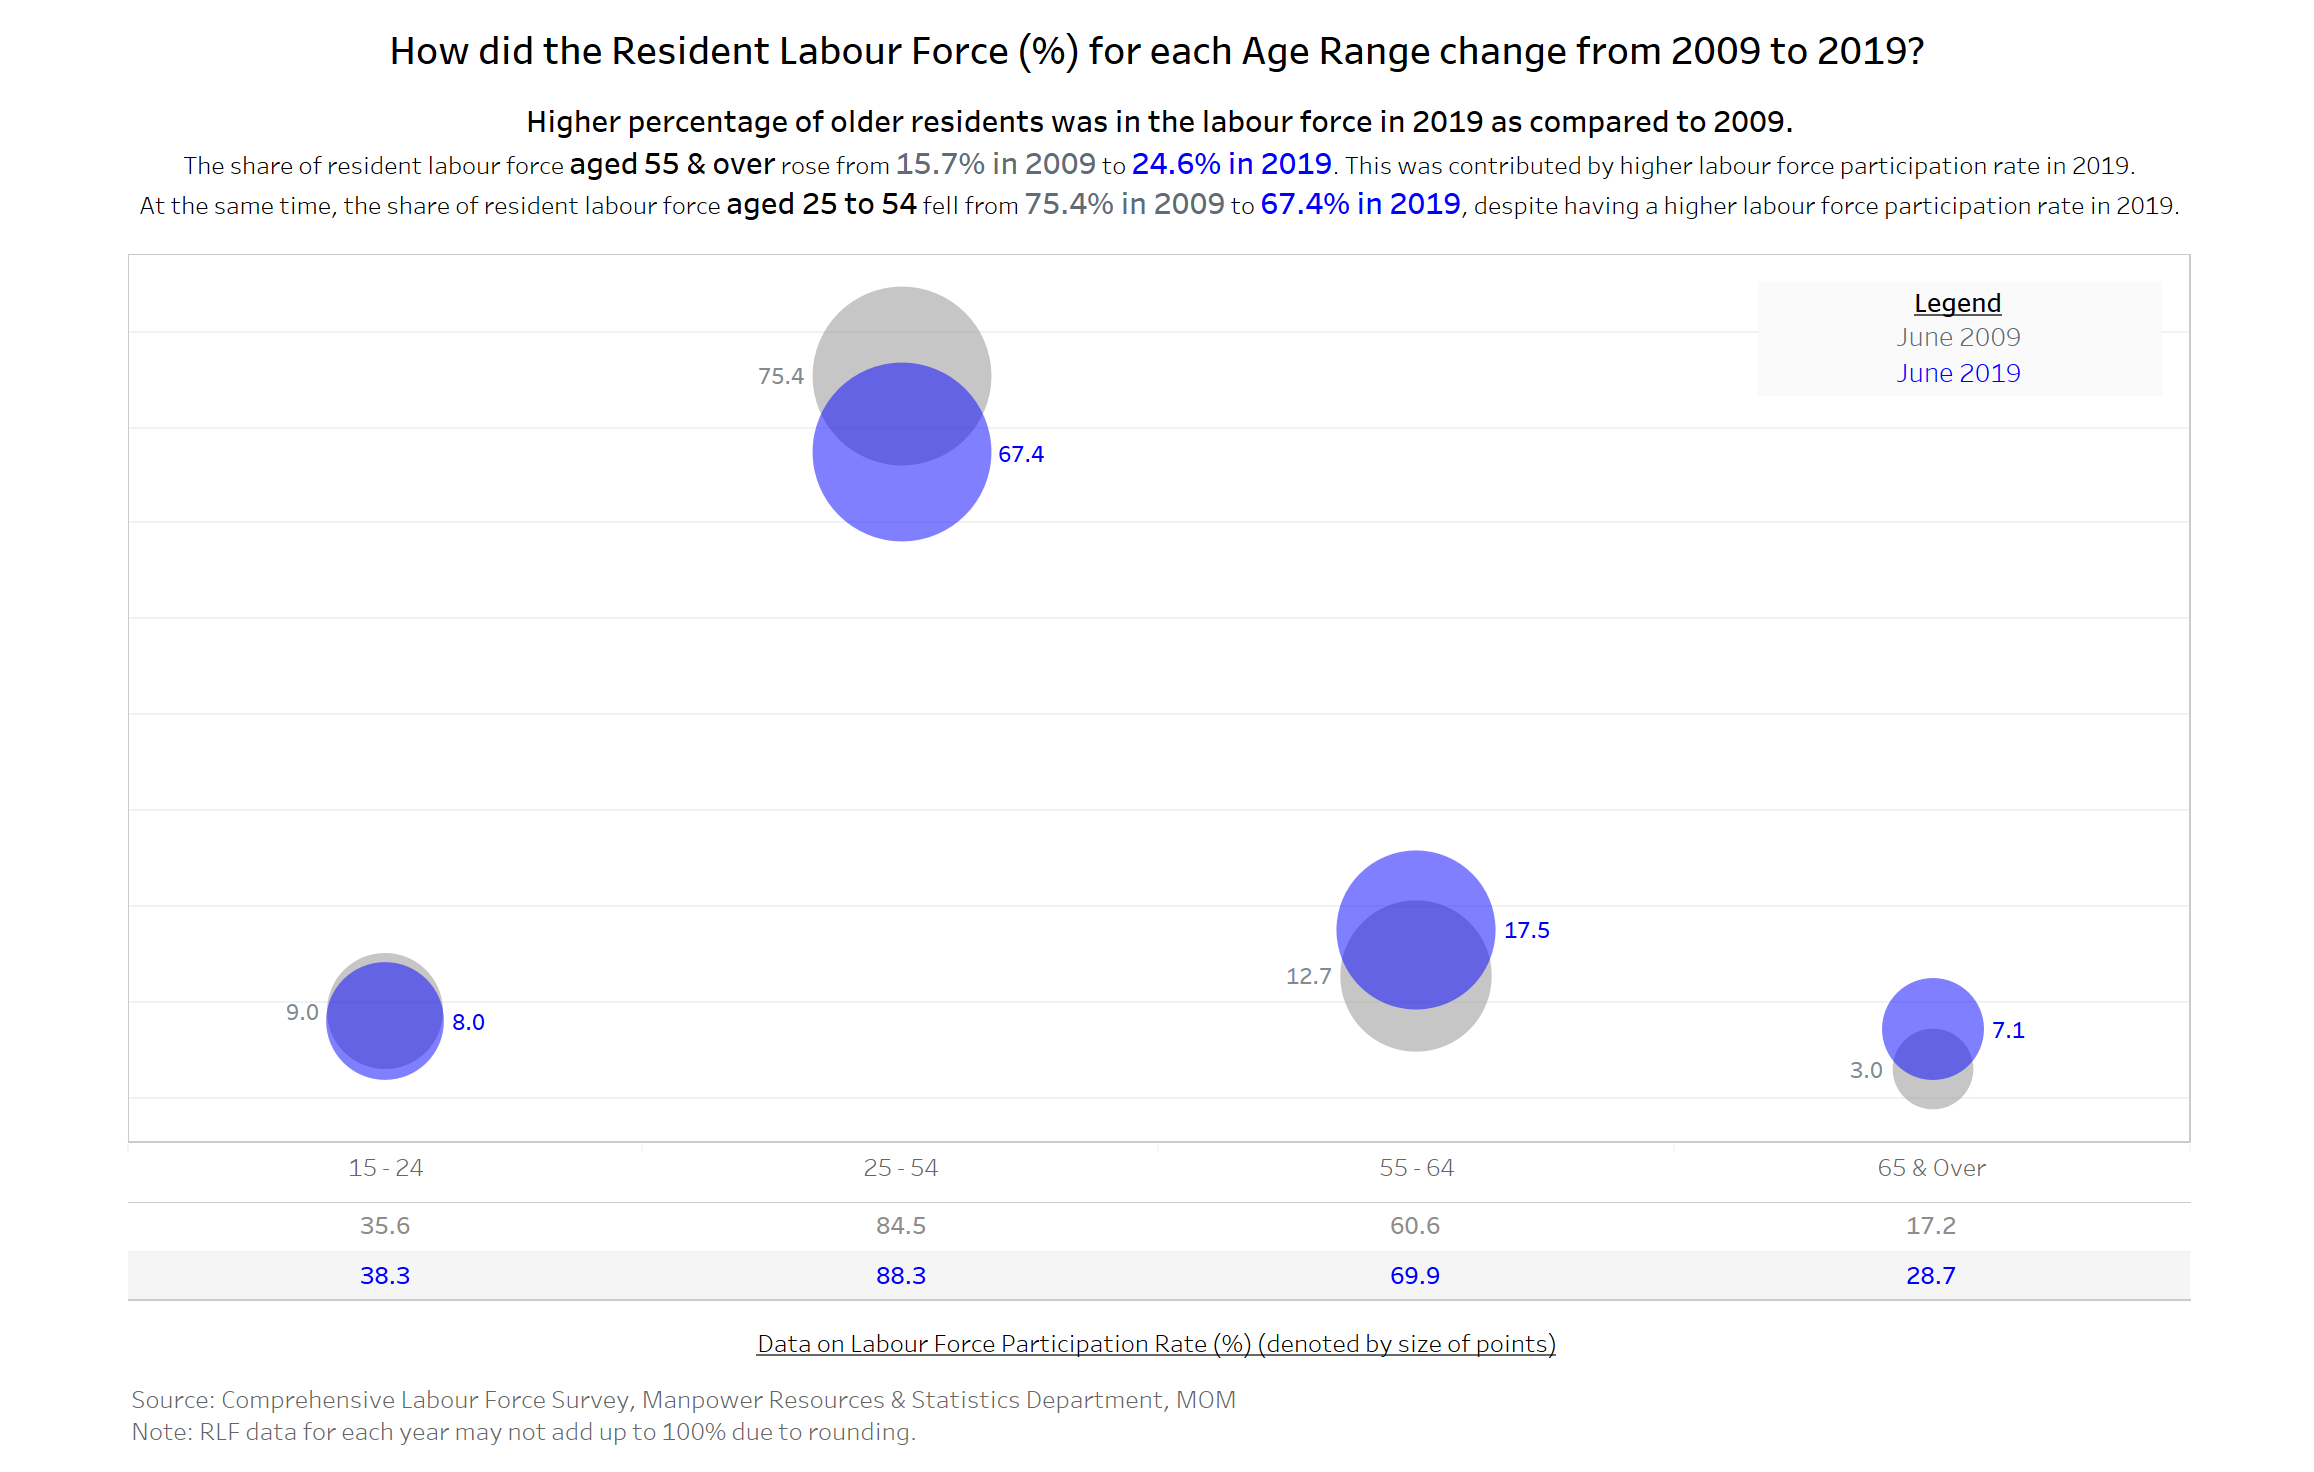
Major Observations
- A higher percentage of older residents was in the labour force in 2019. The share of resident labour force aged 55 & over rose from 15.7% in 2009 to 24.6% in 2019.
- This was contributed by the higher labour force participation rate for residents aged 55 to 64 (69.9% in 2019 vs 60.6% in 2009) and residents aged 65 & over (28.7% in 2019 vs 17.2% in 2009).
- At the same time, the share of resident labour force aged 25 to 54 fell from 75.4% in 2019 to 67.4% in 2019. This was despite having a higher labour force participation rate in 2019 (88.3%) than 2009 (84.5%).